
The surge of people risking their lives to cross the Mediterranean – described by the UN as “a tragedy of epic proportions” – has brought international attention to the issue of migration in recent months. Public anxiety about a looming European migration crisis, caused by large uncontrolled inflows from Africa and the Middle East, is growing.
How the European Union should respond to the rising influx and whether to relax or restrict immigration are hotly debated issues, but political rhetoric and populist media dominate over factbased discussions. Who would be better equipped to neutrally inform public and political debates on migration than the scientific community?
Surprisingly, though, social scientists have been rather cautious about how to effectively communicate their findings to a wider audience, and their research has typically focussed on just one specific country or region. But because migration is a truly global phenomenon, the current inflows to Europe can be much better understood if placed in a wider context.
However, understanding where people are moving around the world has been difficult because of a lack of both comparable statistics and effective ways of extracting meaningful patterns and trends.
Migration is quantified using two types of data. Stock data is the number of migrants residing in a country, which is relatively easily to collect and compare across countries. Flow data are more dynamic, summarising the movement of people over a defined period. This allows for a better understanding of patterns and future trends, but many countries do not collect flow data and those that do use different definitions, making comparison difficult.
In a study published in the journal Science last year, we gave the first comprehensive view of international migration flows over the 20-year period 1990–2010 (this timeframe does not reflect recent trends such as movements triggered by the recession in southern Europe or the violent conflict in Syria).
To quantify the global flow of people, we developed a methodology which estimates the number of movements required to meet recorded changes in migrant stock data. We applied this method to the UN’s stock data to provide a series of “origin to destination” flow estimates in five-year periods. “Illegal” migrants and refugee movements are included where they are considered in the UN’s data.
Contrary to the conventional wisdom, that globalisation results in a rising tide of migration, our method indicates that migration has been relatively stable since 1995. At the global level, an average of just 6 in 1000 people moved between countries within each five-year period.
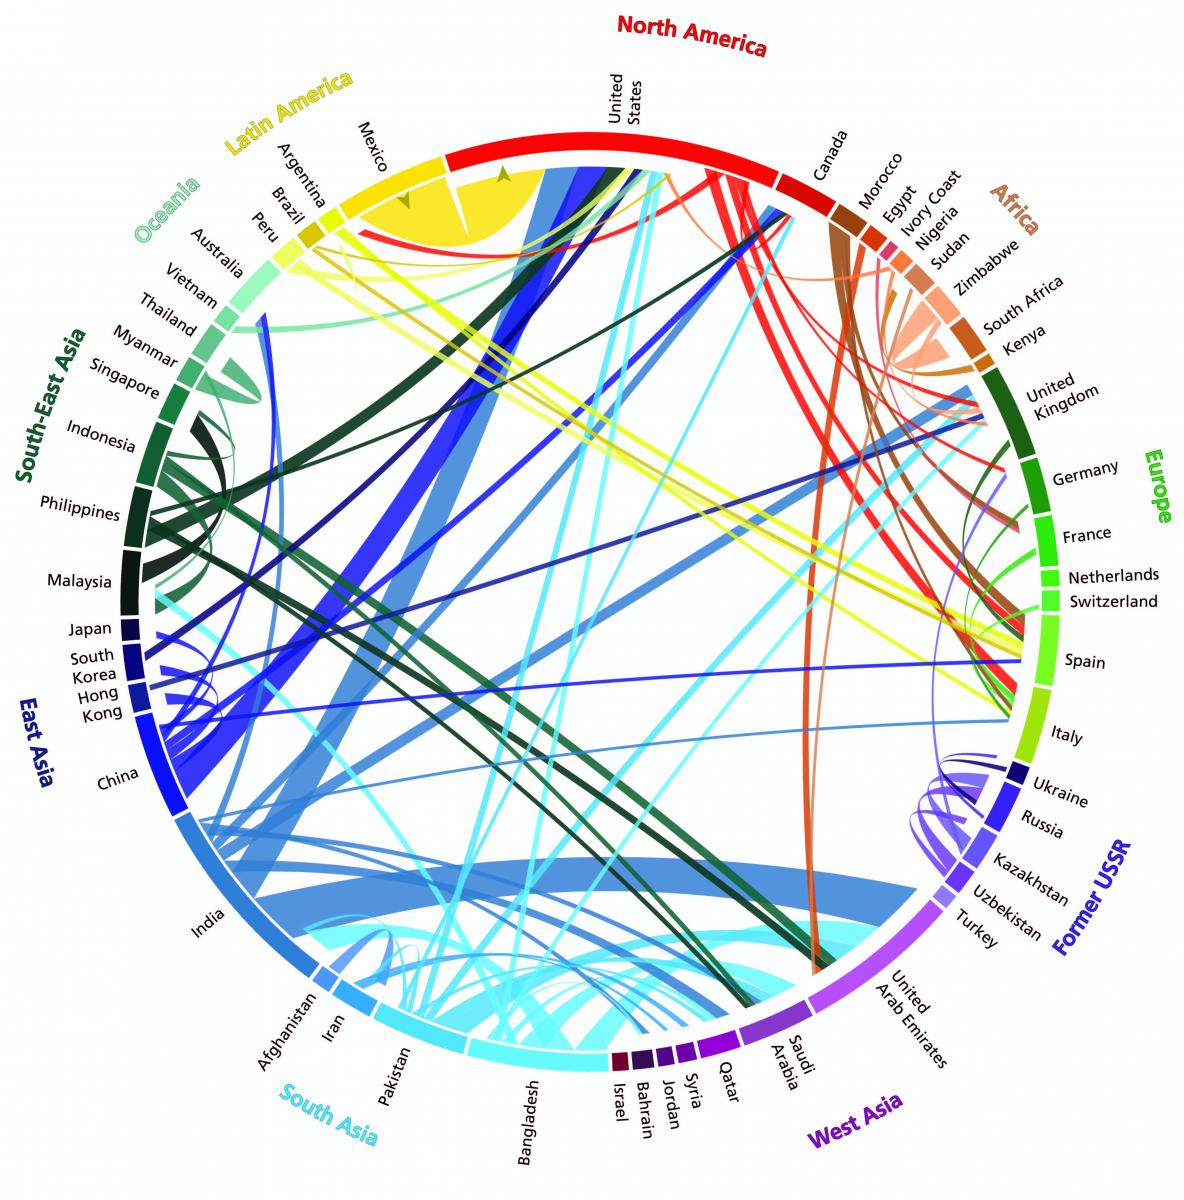
Visualising the complex patterns of global migration is essential for bridging the gap between science and the public. Our easy-to-read graphic shows the relative size and direction of migration streams within the global system of flows. By focussing on migration between the 50 countries with the largest volume of movement (in excess of 70,000 people), we can highlight where people are migrating to in one visualisation.
The data show that most migrants move over short distances within the same region or between neighbouring regions, and relatively few move between continents. North America, Europe and the oil-rich Gulf countries in western Asia are the destinations of flows that come from furthest afield (most of which go through the centre of the circular graphic).
There is also a noticeable circulation of migrants among sub-Saharan African countries that dwarfs the number actually leaving Africa. The media, however, prefer to pay more attention to the latter, which tends to fuel public anxiety. But when the level of income and educational attainment of populations increases, as in Asian and Latin American countries in economic transition, the rate of migration to Western countries also increases.
Over the period 1990–2010, Asia has become an important hub in the global migration system, and a growing number of people migrated from Asia to North America and Europe. Between 2005 and 2010, the oil-based construction boom on the Arabian Peninsula triggered a flow of about 4.9 million people from south Asia to west Asia.
You can take your own tour of the global flow of people by visiting the interactive version of our visualisation, created together with Null2 Berlin, at: www.global-migration.info.
Nikola Sander and Ramon Bauer are research scholars at the Vienna Institute of Demography of the Austrian Academy of Sciences